Social networking giant Facebook believes that different ads have different values based on the context under which it is played. The tech team at Facebook says that an ad experience is not just a single experience, but a variety of unique and different experiences.
How was this determined?
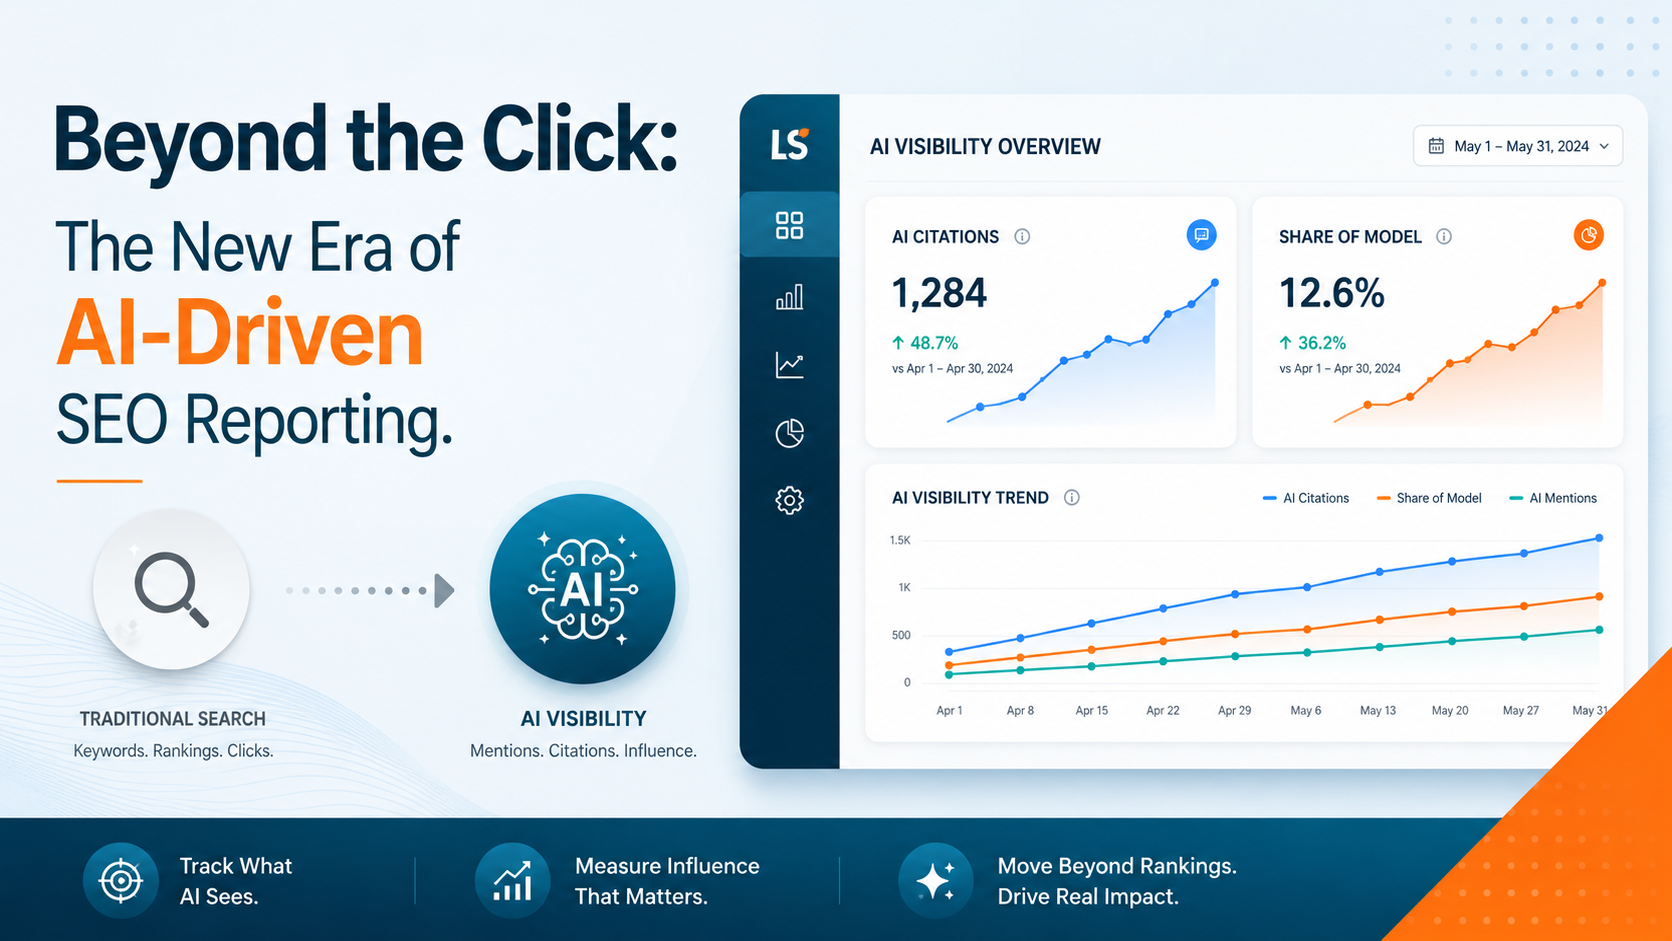
Facebook goes so far as to provide charts to show how many people watch ads and how the ads’ watch times fluctuate according to its environment. However, Facebook does not provide the exact facts and figures with the charts, which don’t make them absolutely conclusive. The data provided, however, is Facebook’s internal data and contains most of the information from this source. There is some information from YouTube and some other companies who place ads on their products, such as Instagram, and Spotify, which makes this data more reliable in terms of data authenticity.
Usually, companies placing ads on their videos and products evaluate the ad quality based on how many people completed the ad or how many people watched more percentage of the ad which was placed. This is called completion rate, and companies usually use this to judge an ad’s ability to keep the audience engaged. However, at Facebook, the ad’s quality is determined by exactly how many seconds the ad was viewed by a person before skipping it, and then using all the collected data to determine how many people watched the ad up to the same second.
What does the data show?
Facebook has started placing ads on videos pretty recently, and they mostly have two types of ads, pre-roll ads, and mid-roll ads. Pre-roll ads are non-skippable and are needed to be completed by the user in order to continue watching the video. Mid-roll ads are longer, skippable ads, which are usually fifteen seconds long, and can be skipped after five seconds.
After collecting all the data on the number of people who completed pre-roll ads and the people who completed mid-roll ads, Facebook observed that majority of people skipped mid-roll ads after five to six seconds, which meant that most of the people on the social network had around six-second attention span toward the ads.
This data primarily meant that in-stream ads put up by Facebook mostly ended up being watched for six seconds, in case of pre-roll and mid-roll ads, both.
Data depiction made easy with charts
Facebook released various charts depicting how their ads have fared over time. The charts mainly consisted of standalone ads which Facebook inserted in people’s news feed, skippable and non-skippable ads placed in-stream, story ads added in people’s Instagram stories, and Live TV ads which were embedded in live streams.
The charts indicate that Facebook’s pre-roll ads, which are the non-skippable ads, perform better than any other type of ad provided by Facebook. This basically suggests that brands can redirect all the money they have put in other kinds of ads and put them into placing pre-roll ads on Facebook.
Why the need for this exercise?
Facebook says they want investors to look at the time for which their ads are being viewed, and invest more money into it, rather than getting caught up in comparing completion rates and deciding where to invest more money for ads.
With these stats and charts, Facebook tries to make sense of the value of tying up experiences to an ad and how it delivers value to a brand.