What is the Google Data Studio?
It’s a free data visualization tool from Google. Launched in beta mode in 2016, it came out of the beta stage in October 2018. The simple drag-and-drop interface makes it easy to create complex charts and reports, without the need for any technical know-how.
Using the Google Data Studio, you can create interactive and engaging data reports. The most significant benefit of Google Data Studio is that it lets you pull in data for reports from various sources like Google Ads, Google Sheets, Google Analytics, Google Search Console, MySQL, YouTube and more.
The Google Data Studio lets you visualize your data in various forms – graphs, charts, pivot tables, bar graphs, pie charts, heat maps, scatter charts, scorecards, geo maps, and more. Additionally, you can customize the report in several ways. Change shapes, background colours, fonts, add logos/images, object properties and more.
In simple words, the Google Data Studio is a powerful business intelligence tool that connects all your separate business data sources to create beautiful, interactive reports.
Why use it?
- It’s free
- It is intuitive and easy to use
- Easy to create customized reports
- A great visual tool for data analytics
- Easy to connect with other Google suite products
- Easy to share and collaborate
- Reliability, trust, and scalability of Google
A Quick Tutorial to Getting Started with Google Data Studio
Step 1: Login to Google Data Studio
Start by clicking on datastudio.google.com. Login using the Google account you use for Google Analytics. The interface of Google Data Studio is similar to other Google tools like Google Drive. The data studio will store only documents created using it. The data is divided into two formats:
- Reports and
- Data sources
Step 2: Create a Report
In the reports tab, click on the “+” button at the top left or bottom right. This opens a blank report. You can also make use of the various available templates that pull in data from the Search Console, Google Analytics, Google Sheets, Google Ads, or Google BigQuery.
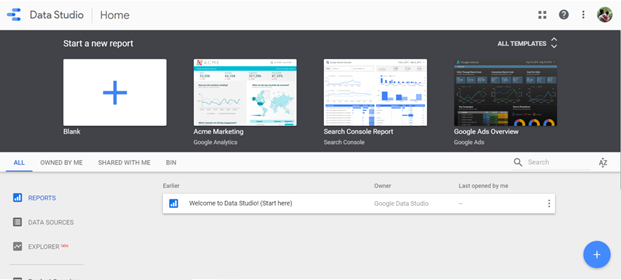
Image via Google Data Studio
Step 3: Connect Data
To load data from a source, click on the Data Sources tab, and choose, “Create New Data Source,” or click on “Connect to Data,” option at the bottom. You can pull in data from over 160 connectors – 17 Google Connectors and over 135 Partner Connectors.
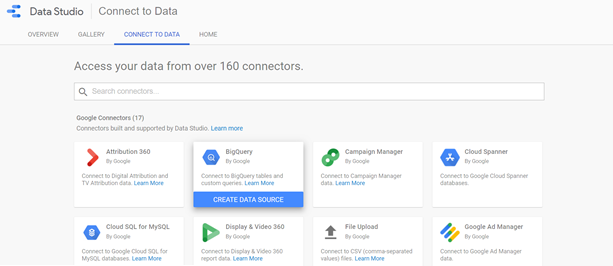
Image via Google Data Studio
Once you have chosen the preferred data source, you need to connect the Data Studio to the Google Analytics account. Next, select account ?Property ? View. This opens a spreadsheet of metrics or fields. Click on the “Add to Report” button at the top-right corner of the screen, to integrate data from your chosen data source to report. You can also add data from multiple data sources.
Step 4 – Customize the Report
The report is a blank grid that you can add several types of visualizations. Google Data Studio lets you customize the theme and layout of the report.
You can visualize data in various forms – bar charts, pie charts, combo charts, bullet charts, scatter charts and more. Additionally, you can also add images, shapes, and text to the report. Once you have chosen the visualization, drag it to its preferred size and release it on your report. Your data visualization appears on the chart immediately.
Use the right-hand sidebar of the report to edit your visualization. You can change the date range, metrics, dimensions, data source, sort data, filter and more.
Data Analysis and Presentation Made Easy with Google Data Studio
With Google Data Studio, it’s quite easy to configure and present your data in various ways. It makes it easy to analyze and extract insights from your data, thereby helping you enhance the efficiency and usage of your data.
Here’s a recap of all that you can do with Google Data Studio:
- Visualize data using customized charts and tables
- Make reports using data from a variety of sources
- Share your insights with your team, your clients and others
- Collaborate on report creation with the rest of your team
- Speed up the report creation process using in-built templates