The kind of launch and announcements which happened last month, I don’t think we have witnessed anything of this sort in last two years on social media analytics & insights front.
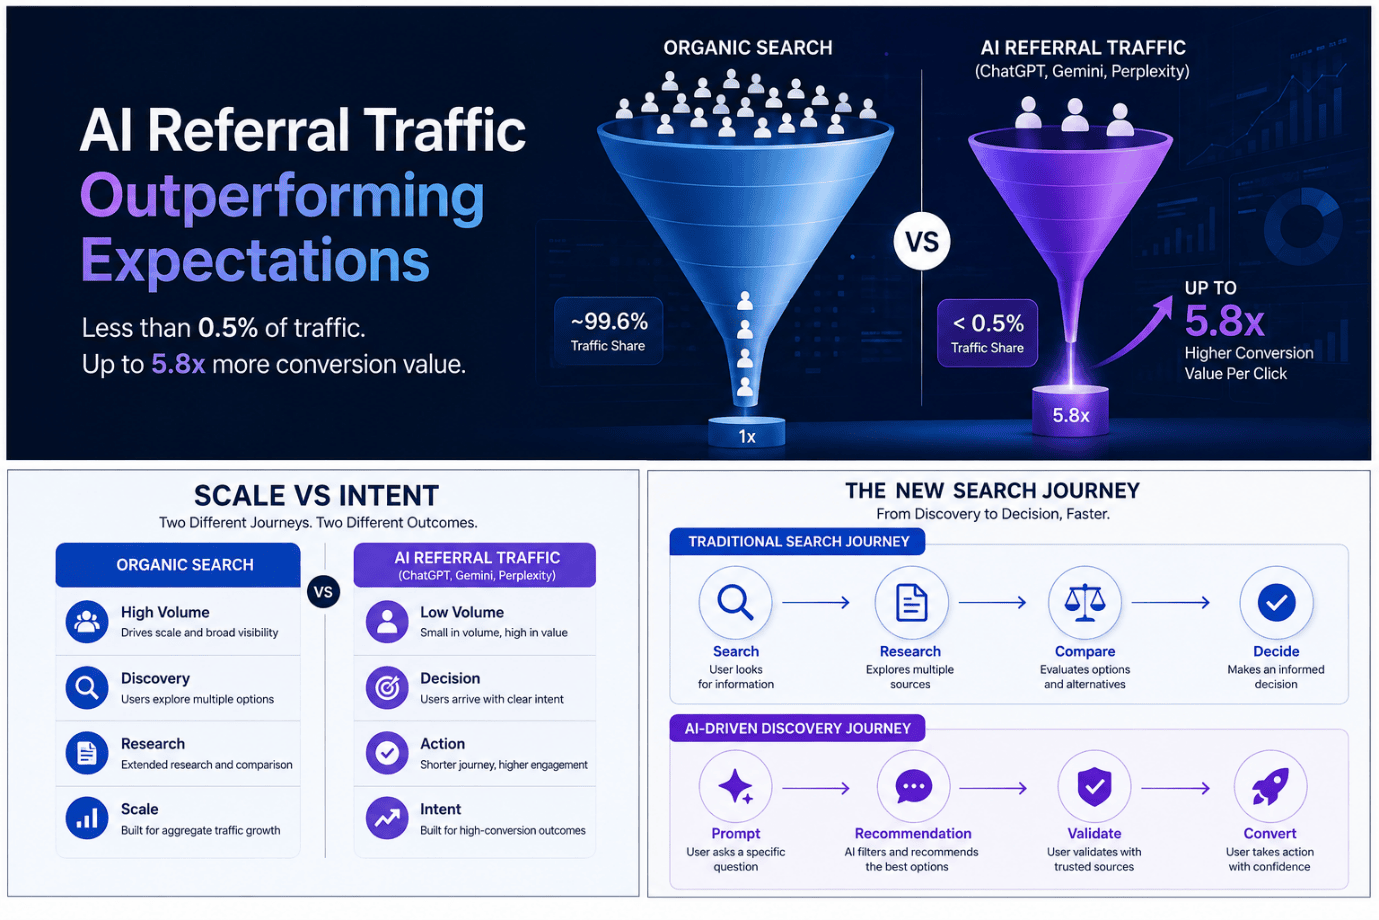
Twitter native analytics open to all users, Pinterest analytics launch for business accounts and finally Instagram business tool announcement clearly suggest one thing that these big platforms are here to fill the need of much awaited marketers demand i.e. brand communication performance on these platform or as we know it popularly, insights.
This also indicates how these platforms have changed gears to monetise their property aggressively. It highlights one important trend of recent times that how an image-driven engagement evokes a powerful emotional connections and response among users, growing active users of Pinterest and Instagram, a case in point.
Dashboard:
So what is the deal with Twitter’s newly launched analytics and their dashboard. Let’s decipher it.
As soon we land on analytics.twitter.com through our personal or business handle, we are welcomed by a dashboard mixed with graphs, stats and different menu tabs on top.
Tweets:
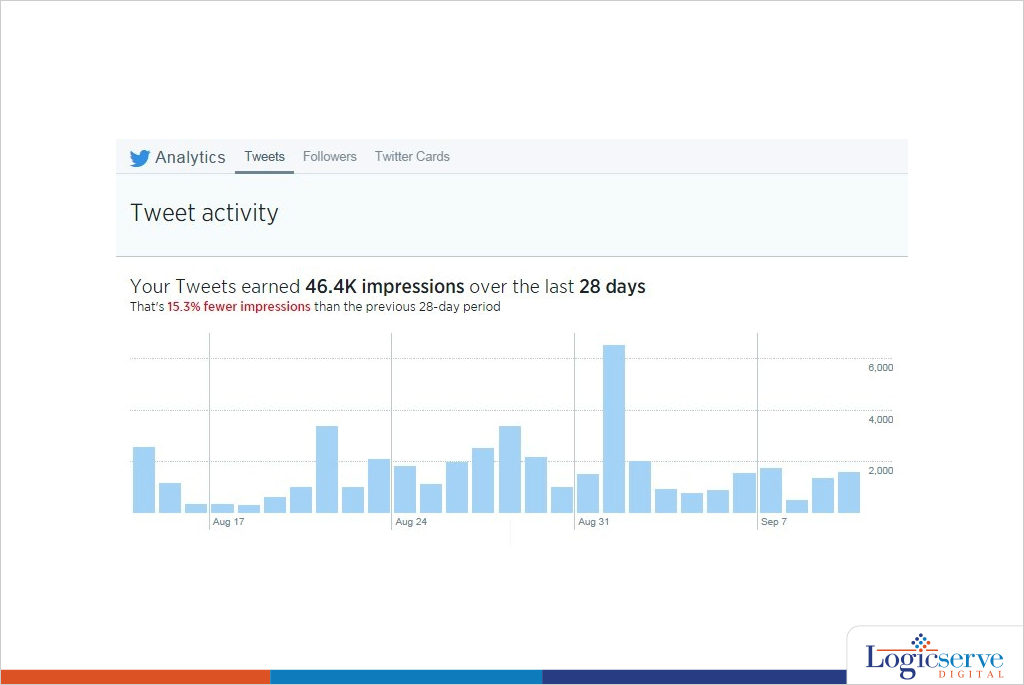
The first option on top is Tweets which shows all the recent tweets with their Impressions, Engagements & Engagement rates.
Tweets is further subdivided into ‘Tweets and replies’ & Promoted tweets (tweets used for paid campaign)
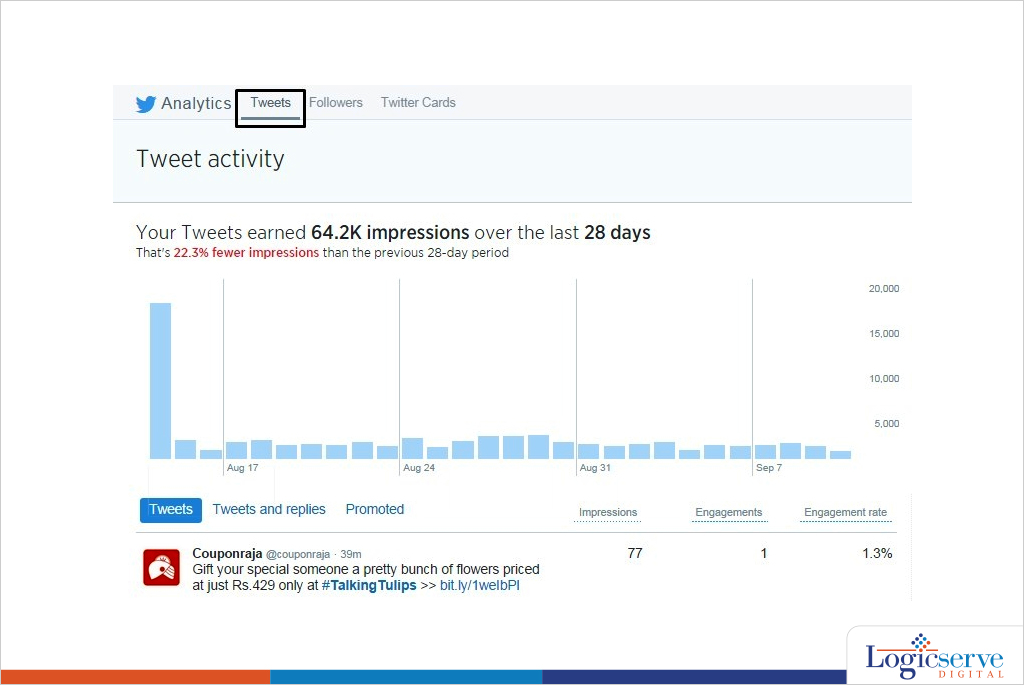
Decoding Impressions & Engagement:
Impressions is defined here as ‘Number of times users saw the Tweet on Twitter’, Engagement here is ‘Total number of times user has interacted with a tweet. This includes all clicks anywhere on the tweet (including hashtags, links, avatar, username and Tweet expansion), retweets, replies, follows and favorites. Engagement rate is the number of engagements divided by total no. of impressions.
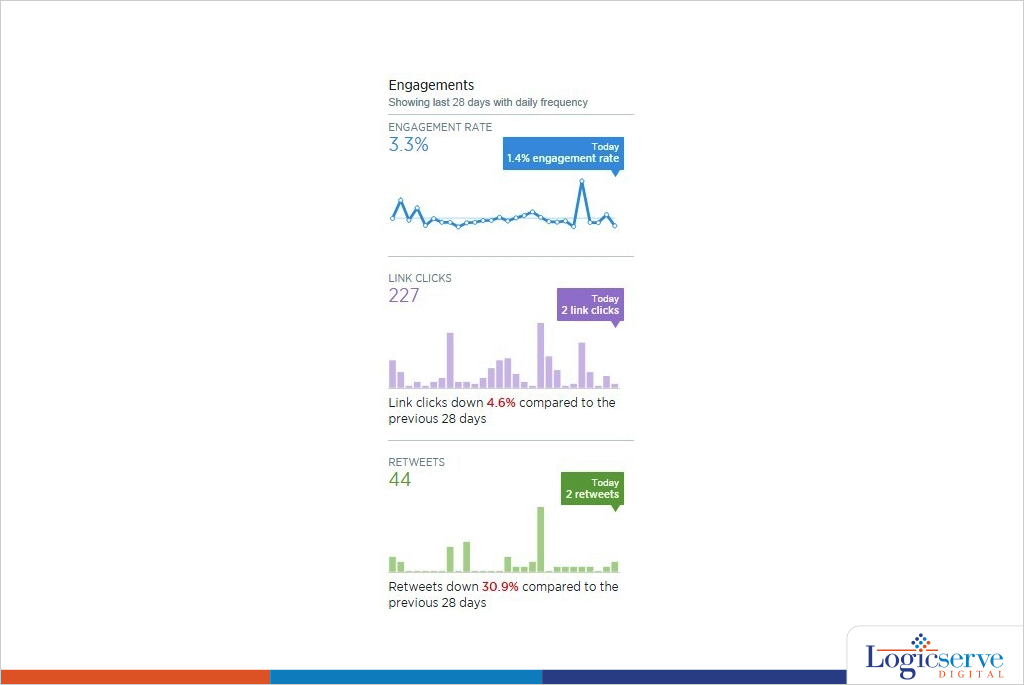
The right hand side column showcases impressions, engagement rate, link clicks, retweets, favorites and replies calculating average over a period 28 days.
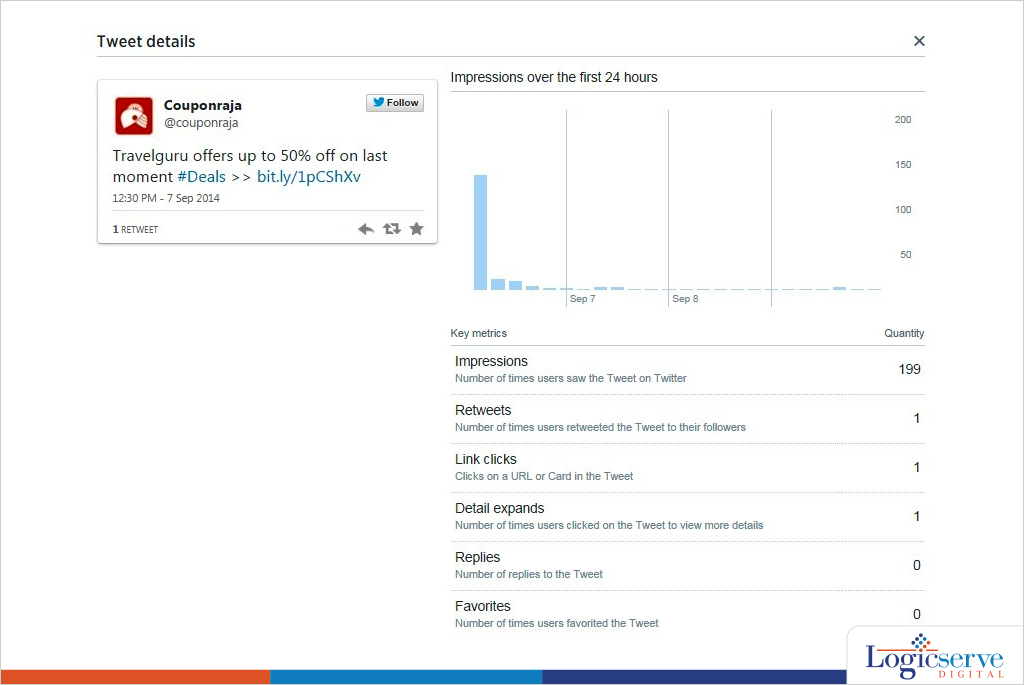
One of the things in this dashboard which I really liked was when you click on the tweet data it throws up a pop-up info which dissects how the tweet has performed. It shows details like Impression graph, User Profile Clicks, Details Expand, ReTweets, Favorites & Replies.
The “Tweets” menu on the top also gives the insights on how to maximise the brand’s presence in the platform. Alongside it also plays a vital role whenever you create your next Twitter strategy.
Through this feature you can know :
Best time to post your tweet: The no. of impressions could tell us, the most appropriate time to tweet.
Content: Going by engagement rate we can differentiate a good content from a bad one. It would also tell which ‘type’ of content (image, text, video, link, vine) works better.
Followers:
Second option on top menu is Followers
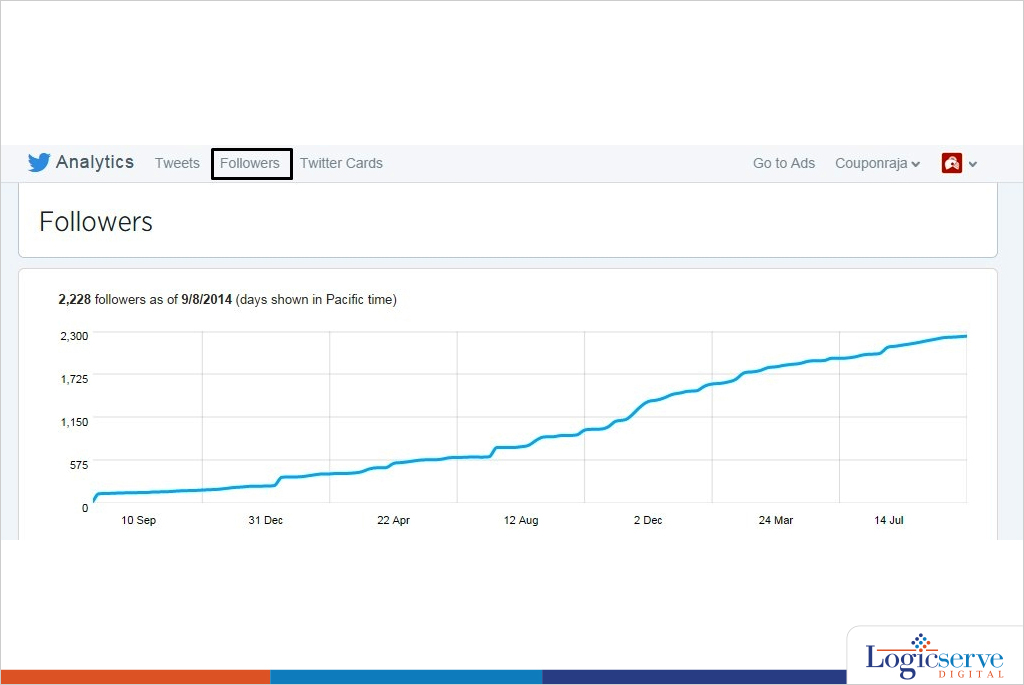
Followers give a very good insight about the user base of the twitter handle.
Some of the key things in these features:
Graphs with followers gained over a period of two years.
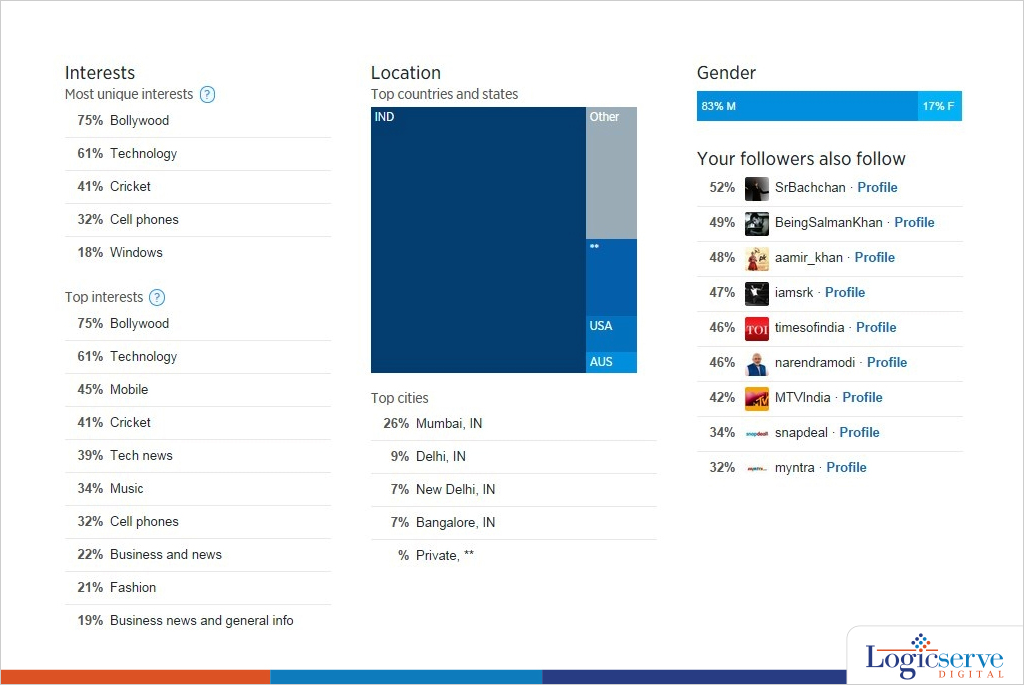
- Interests (The top 5 most unique interests of your followers)
- Top 10 interests
Location graph with top cities
Gender Segregation
- Top Profiles of users with ‘Your followers also follow’
Twitter Cards:
This is the last option on top menu.
Twitter card analytics feature is to track the paid promotion which includes URL Clicks, App Install Attempts data & Retweets.
Overall, twitter analytics is by far one of the most simple & comprehensible dashboard. With Twitter ‘Buy’ button coming in picture this would be an integral to track transactions.
Previous Post: Google Authorship May be Dead, But, You are Still Writing. Aren’t You?